
johnlloyd_13
Explorer III
January 19, 2024
Solved

Interface Bandwidth Widget

  • January 19, 2024
  • 2 replies
  • 3819 views

hi,

i would like to constantly monitor our WAN utilization in a certain VDOM.

i already added a widget under dashboard > network > interface (added WAN subif).

my question are:

1.is this widget permanent? or is it auto removed after my login session?

2.can other admin see/view the widget i created? or is this view only exclusive to my profile?

3.i can only see 1 hour, 24 hour and 1 week view option? is this fix or can i adjust this view to 12 hours or 30 days/1 month, 12 months?
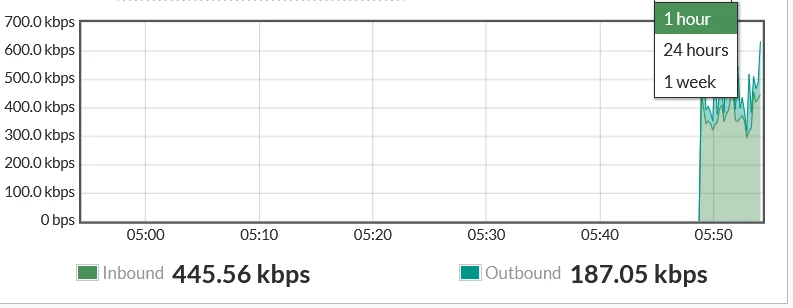
image.png

Best answer by kaman

Hi johnlloyd_13,


You can check and monitor the bandwidth utilization through dashboard > network > interface (added WAN subif)


> When you add the widget, it will be visible under the Dashboard and will remain there permanently rather than being automatically removed after the login session.


> Can other admin see/view the widget i created? = No, it will not be visible to other admin


> You can only check the bandwidth only for durations of 1 hour, 24 hours, and 1 week.


> You can also monitor the usage of bandwidth per source. Please refer to the document below for more information:


https://community.fortinet.com/t5/FortiGate/Technical-Tip-Monitor-bandwidth-usage-per-source/ta-p/195772


I hope it will help you.

2 replies

kaman
Staff
kamanAnswer
Staff
January 19, 2024

Hi johnlloyd_13,


You can check and monitor the bandwidth utilization through dashboard > network > interface (added WAN subif)


> When you add the widget, it will be visible under the Dashboard and will remain there permanently rather than being automatically removed after the login session.


> Can other admin see/view the widget i created? = No, it will not be visible to other admin


> You can only check the bandwidth only for durations of 1 hour, 24 hours, and 1 week.


> You can also monitor the usage of bandwidth per source. Please refer to the document below for more information:


https://community.fortinet.com/t5/FortiGate/Technical-Tip-Monitor-bandwidth-usage-per-source/ta-p/195772


I hope it will help you.

AEK
SuperUser
SuperUser
January 19, 2024

Hi

If you want a X months graph then it should be possible with FortiAnalyzer or with NetFlow.

AEK
Thought Leadership Security Summit. Outpace New Threats with AI - enhanced defense. Tuesday, Septmeber 15, 8:30 AM - 2:30 PM PT. The Golf Club at Newcastle, WA.
Fortinet Flag the Hack. Wednesday, August 26, 9:00 AM - 5:00 PM ET, COSM, Atlanta, GA.
Virtual event | September 2026. SASE summit. The age of autonomous trust. Register here!