Identify the failure signature:
The Groups view may show a nonzero Total value while Displayed remains 0.
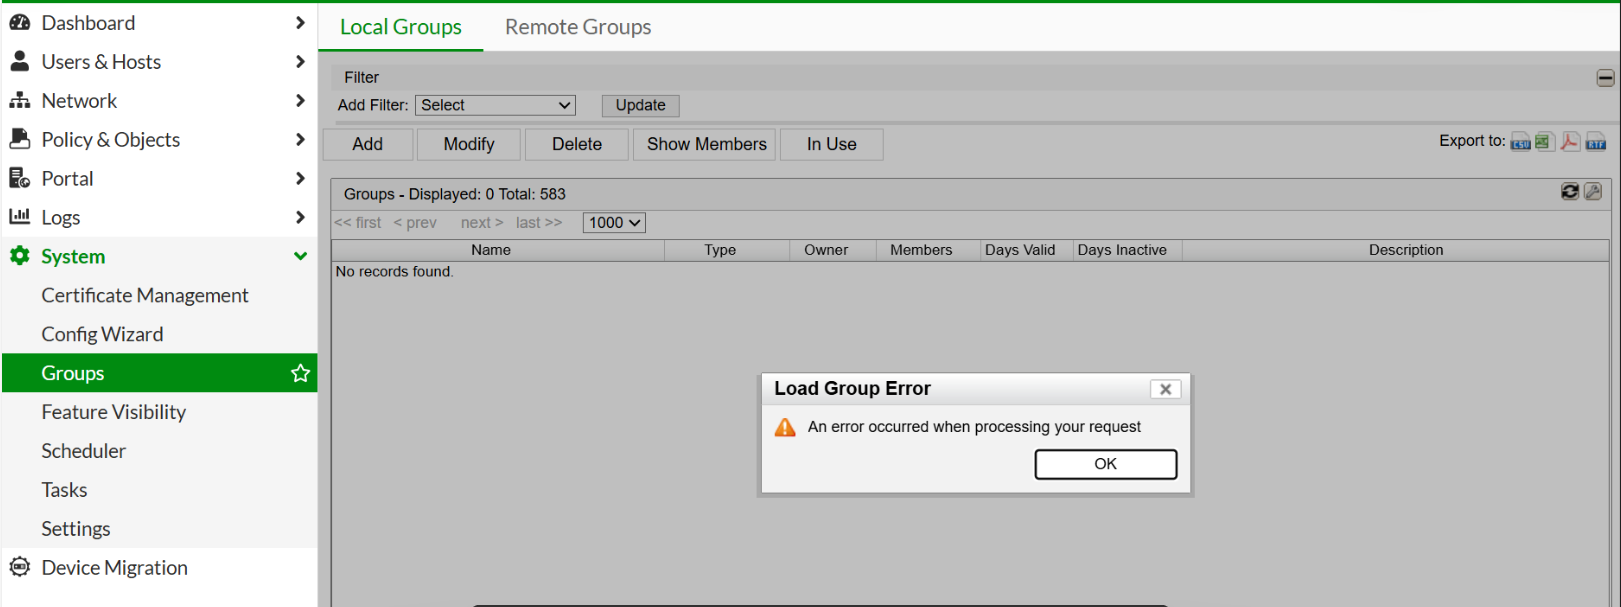
In the reported case, the following request failed with HTTP 500:
GET /actions/system/group/all-group-details/
The corresponding application log contained the following exception:
WARN yams.RestExceptionMapper - url:
https://<FortiNAC>:8443/actions/system/group/all-group-details/

java.lang.StackOverflowError: null
    at org.hibernate.loader.entity.CacheEntityLoaderHelper.loadFromSessionCache(CacheEntityLoaderHelper.java:88)
    at org.hibernate.event.internal.DefaultLoadEventListener.doLoad(DefaultLoadEventListener.java:512)
    at org.hibernate.event.internal.DefaultLoadEventListener.load(DefaultLoadEventListener.java:208)
    at org.hibernate.event.internal.DefaultLoadEventListener.proxyOrLoad(DefaultLoadEventListener.java:327)
    at org.hibernate.event.internal.DefaultLoadEventListener.doOnLoad(DefaultLoadEventListener.java:108)
    at org.hibernate.event.internal.DefaultLoadEventListener.onLoad(DefaultLoadEventListener.java:74)
A full stack trace will be needed for proper investigation.
Correlate the browser request with the application log:
Open the browser developer tools, select Network -> Preserve log.
Reproduce the issue once, and inspect the request’s status, query parameters, and response body. Chrome exposes these details through the Headers, Payload, and Response tabs.
At the same time, monitor from FortiNAC CLI:
diagnose tail -F output.master
After reproducing the failure, press Ctrl+C to stop the live capture. Then download the log snapshot: Technical Tip: How to get a debug log report from FortiNAC-CA or FortiNAC-Manager.
Perform read-only database inspection:
execute db-shell
SELECT
    COUNT(*) AS group_row_count
FROM `Group`;
Example output:
MariaDB [bsc]> SELECT
    ->     COUNT(*) AS group_row_count
    -> FROM `Group`;
+-----------------+
| group_row_count |
+-----------------+
|             140 |
+-----------------+
1 row in set (0.000 sec)
SELECT
    `ID`,
    `name`,
    `LAST_MODIFIED_DATE`
FROM `Group`
ORDER BY
    `LAST_MODIFIED_DATE` DESC,
    `ID` DESC
LIMIT 50;
Example output:
MariaDB [bsc]> SELECT
    ->     `ID`,
    ->     `name`,
    ->     `LAST_MODIFIED_DATE`
    -> FROM `Group`
    -> ORDER BY
    ->     `LAST_MODIFIED_DATE` DESC,
    ->     `ID` DESC
    -> LIMIT 50;
+------------------+-----------------------------------------+------------------                                                                             ---+
| ID               | name                                    | LAST_MODIFIED_DAT                                                                             E  |
+------------------+-----------------------------------------+------------------                                                                             ---+
| 1421994961006596 | ROGUE_CLIENTS                           | 2026-09-28 15:02:                                                                             10 |
| 1497703305695260 | testgroup_host                          | 2026-09-28 04:01:                                                                             00 |
| 1497703305654299 | testgroup_user                          | 2026-09-28 04:01:                                                                             00 |
| 1497703305453593 | fortinacgrp_host                        | 2026-09-28 04:01:                                                                             00 |
| 1497703305383960 | fortinacgrp_user                        | 2026-09-28 04:01:                                                                             00 |
| 1468957178937353 | testou5_host                            | 2026-09-28 04:01:                                                                             00 |
| 1468957178880007 | testou5_user                            | 2026-09-28 04:01:                                                                             00 |
| 1468957178806277 | testou4_host                            | 2026-09-28 04:01:                                                                             00 |
| 1468957178732547 | testou4_user                            | 2026-09-28 04:01:                                                                             00 |
| 1468957178613761 | testou3_host                            | 2026-09-28 04:01:                                                                             00 |
| 1468957178531871 | testou3_user                            | 2026-09-28 04:01:                                                                             00 |
| 1468957178392605 | testou2_host                            | 2026-09-28 04:01:                                                                             00 |
| 1468957178290203 | testou2_user                            | 2026-09-28 04:01:                                                                             00 |
| 1468957178175513 | testou1_host                            | 2026-09-28 04:01:                                                                             00 |
| 1468957178060823 | testou1_user                            | 2026-09-28 04:01:                                                                             00                                                         ---+
15 rows in set (0.001 sec)
Provide logs to TAC:
output.master logs. Database outputs. browser error from FortiNAC GUI. Browser logs from Developer Tools (Headers, Payload, and Response tabs).
|