- Forums
- Knowledge Base
- Customer Service
- Internal Article Nominations
- FortiGate
- FortiAP
- FortiClient
- FortiADC
- FortiAnalyzer
- FortiBridge
- FortiAuthenticator
- FortiCache
- FortiCarrier
- FortiCASB
- FortiConnect
- FortiConverter
- FortiCNP
- FortiDAST
- FortiDDoS
- FortiDB
- FortiDNS
- FortiDeceptor
- FortiDevSec
- FortiDirector
- FortiExtender
- FortiEDR
- FortiGate Cloud
- FortiGuard
- FortiHypervisor
- FortiInsight
- FortiIsolator
- FortiMail
- FortiMonitor
- FortiManager
- FortiNAC
- FortiNAC-F
- FortiNDR (on-premise)
- FortiNDRCloud
- FortiPAM
- FortiPortal
- FortiProxy
- FortiRecorder
- FortiRecon
- FortiSandbox
- FortiScan
- FortiSASE
- FortiSIEM
- FortiSOAR
- FortiSwitch
- FortiTester
- FortiToken
- FortiVoice
- FortiWAN
- FortiWeb
- FortiWebCloud
- Wireless Controller
- RMA Information and Announcements
- FortiCloud Products
- ZTNA
- 4D Documents
- Customer Service
- Community Groups
- Blogs
Support Forum
The Forums are a place to find answers on a range of Fortinet products from peers and product experts.
- Fortinet Community
- Forums
- Support Forum
- Re: Custom dataset - show occurrences of certain l...
Options
- Subscribe to RSS Feed
- Mark Topic as New
- Mark Topic as Read
- Float this Topic for Current User
- Bookmark
- Subscribe
- Mute
- Printer Friendly Page
Options
- Mark as New
- Bookmark
- Subscribe
- Mute
- Subscribe to RSS Feed
- Permalink
- Report Inappropriate Content
Custom dataset - show occurrences of certain log type across time
Hello everyone,
I am trying to create a custom line graph that will show occurrences of a certain log message over time, so you can easily see the spikes of when this event occurs a lot.
I started by creating a custom chart from Log View section showing the log results I care about. But I end up with a graph that doesn't work - there are no lines on it. Running the test query function in the dataset does show me the log results I care about.
Guessing the issue is related to grouping/aggregating somehow. If anyone can shed some light I would appreciate it!
These are 3 raw log entries, showing the log messages I care about:
itime=2018-02-21 14:35:05 vd=root rcvdbyte=0 craction=262144 app=443/tcp dtime=2018-02-21 14:35:04 date=2018-02-21 dstip=20.20.20.10 crscore=5 duration=0 sentbyte=0 crlevel=low proto=6 devid=FG200D4Q00000000 poluuid=460bde16-0364-51e7-c774-a7aab6ae4cd1 dstport=443 type=traffic devname=customerFirewall trandisp=noop sessionid=477839005 itime_t=1519248905 policyid=38 srcintf=port1 srcip=10.10.10.20 level=warning appcat=unscanned srcport=61075 logid=11 subtype=forward time=14:35:04 action=ip-conn dstintf=Trust itime=2018-02-21 09:56:20 vd=root rcvdbyte=0 craction=262144 app=443/tcp dtime=2018-02-21 09:56:19 date=2018-02-21 dstip=20.20.20.10 crscore=5 duration=0 sentbyte=0 crlevel=low proto=6 devid=FG200D4Q00000000 poluuid=460bde16-0364-51e7-c774-a7aab6ae4cd1 dstport=443 type=traffic devname=customerFirewall trandisp=noop sessionid=477083575 itime_t=1519232180 policyid=38 srcintf=port1 srcip=10.10.10.20 level=warning appcat=unscanned srcport=50652 logid=11 subtype=forward time=09:56:19 action=ip-conn dstintf=Trust itime=2018-02-21 08:27:12 vd=root rcvdbyte=0 craction=262144 app=443/tcp dtime=2018-02-21 08:27:11 date=2018-02-21 dstip=20.20.20.10 crscore=5 duration=0 sentbyte=0 crlevel=low proto=6 devid=FG200D4Q00000000 poluuid=460bde16-0364-51e7-c774-a7aab6ae4cd1 dstport=443 type=traffic devname=customerFirewall trandisp=noop sessionid=477022798 itime_t=1519226832 policyid=38 srcintf=port1 srcip=10.10.10.20 level=warning appcat=unscanned srcport=50577 logid=11 subtype=forward time=08:27:11 action=ip-conn dstintf=Trust
The fields I care about are:
dstip=20.20.20.10 dstport=443 craction=262144
This is the current query:
select from_itime(itime) as itime, string_agg(distinct ipstr(`dstip`), ' ') as dstip__agg_ from ###(select `itime`, `dstip` from $log where $filter and logid_to_int(logid) not in (4, 7, 14) and ( ( 'Failed Connection Attempts to 20.20.20.10' = ANY(threats)) AND (( (`action`='ip-conn') ))) group by `itime`, `dstip` order by `itime`)### t group by `itime` order by `itime`
Desired output is Y-axis showing count of occurrences, and X-axis showing time (ideally per minute).
Thank you!
Solved! Go to Solution.
1 Solution
Options
- Mark as New
- Bookmark
- Subscribe
- Mute
- Subscribe to RSS Feed
- Permalink
- Report Inappropriate Content
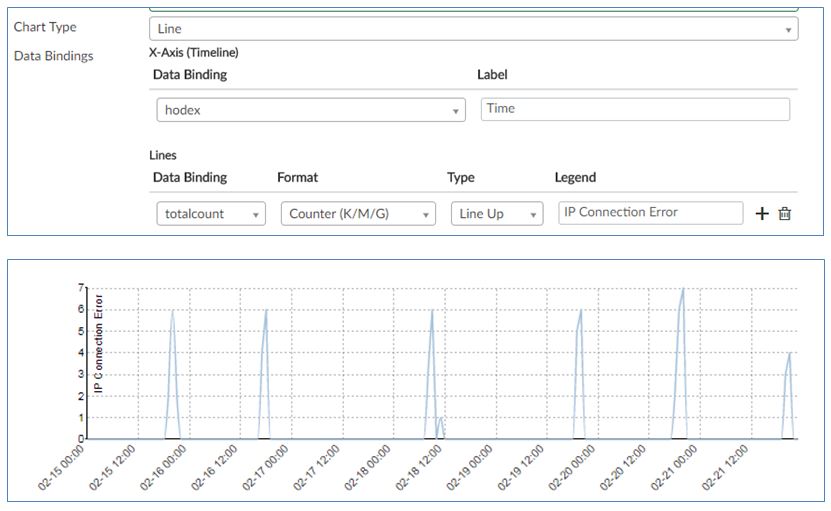
Hello, could you try the below traffic dataset wheter it will fulfill what you need?
SELECT RIGHT($flex_timescale,16) AS hodex, COUNT(*) AS totalcount FROM $log WHERE $filter AND LOGID_TO_INT(`logid`) NOT IN(4, 7, 14) AND `action`='ip-conn' AND `dstip` = inet('20.20.20.10') GROUP BY hodex ORDER BY hodex ASC

AtiT
AtiT
3 REPLIES 3
Options
- Mark as New
- Bookmark
- Subscribe
- Mute
- Subscribe to RSS Feed
- Permalink
- Report Inappropriate Content
With some help from a friend, I got a bit closer using this query:
select count(itime) as itime, from_itime(min(itime)) as nicetime, min(dstip) as ip from $log where $filter and logid_to_int(logid) not in (4, 7, 14) and ( ( ( (`action`='ip-conn') )) AND (`dstip` = inet('20.20.20.10'))) group by round(itime/300) order by nicetime
It seems to pick the first occurrence within a 5min timestamp and report on that, instead of determining the 5-minute time-slices that exist within the data, and counting occurrences there. E.g:
14:00 = 2 14:05 = 3 14:10 = 9 etc, etc
Attached is picture of the result I get from my test query.
Options
- Mark as New
- Bookmark
- Subscribe
- Mute
- Subscribe to RSS Feed
- Permalink
- Report Inappropriate Content
Hello, could you try the below traffic dataset wheter it will fulfill what you need?
SELECT RIGHT($flex_timescale,16) AS hodex, COUNT(*) AS totalcount FROM $log WHERE $filter AND LOGID_TO_INT(`logid`) NOT IN(4, 7, 14) AND `action`='ip-conn' AND `dstip` = inet('20.20.20.10') GROUP BY hodex ORDER BY hodex ASC
AtiT
AtiT
Options
- Mark as New
- Bookmark
- Subscribe
- Mute
- Subscribe to RSS Feed
- Permalink
- Report Inappropriate Content
That worked great, thank you!!!
Announcements
Select Forum Responses to become Knowledge Articles!
Select the “Nominate to Knowledge Base” button to recommend a forum post to become a knowledge article.
Related Posts
- FAZ Dataset query tables, columns and... 116 Views
- Combine Tables In Datasets 195 Views
- Need Help for Custom Datasets FortiAnalyzer 192 Views
- FortiAnalzyer Report - SSLVPN Login and... 427 Views
- FortiAnalyzer Datasets to Query a specific... 358 Views
Labels
-
FortiGate
7,035 -
FortiClient
1,387 -
5.2
801 -
5.4
639 -
FortiManager
610 -
FortiAnalyzer
446 -
6.0
416 -
FortiAP
369 -
FortiSwitch
368 -
5.6
362 -
FortiClient EMS
285 -
FortiMail
272 -
6.2
251 -
FortiAuthenticator v5.5
234 -
5.0
196 -
FortiWeb
172 -
6.4
128 -
FortiNAC
123 -
FortiGuard
112 -
IPsec
104 -
SSL-VPN
94 -
FortiGateCloud
93 -
FortiSIEM
92 -
FortiCloud Products
88 -
FortiToken
76 -
Customer Service
71 -
Wireless Controller
64 -
4.0MR3
64 -
FortiProxy
48 -
FortiADC
45 -
Fortivoice
44 -
SD-WAN
43 -
FortiEDR
42 -
FortiDNS
37 -
FortiExtender
36 -
FortiGate v5.4
35 -
FortiSandbox
33 -
FortiAuthenticator
32 -
FortiSwitch v6.4
32 -
Firewall policy
32 -
VLAN
28 -
High Availability
28 -
FortiConnect
24 -
FortiWAN
23 -
ZTNA
21 -
DNS
21 -
FortiConverter
21 -
BGP
19 -
FortiGate v5.2
19 -
Certificate
19 -
SAML
18 -
FortiPortal
18 -
FortiSwitch v6.2
17 -
LDAP
17 -
VDOM
16 -
FortiMonitor
14 -
Authentication
14 -
FortiLink
14 -
Interface
14 -
FortiDDoS
14 -
Logging
14 -
FortiGate v5.0
13 -
Fortigate Cloud
13 -
Routing
13 -
FortiCASB
12 -
RADIUS
11 -
NAT
11 -
Web profile
11 -
SSL SSH inspection
10 -
Traffic shaping
10 -
Virtual IP
10 -
SSO
10 -
Application control
10 -
FortiRecorder
10 -
SSID
9 -
FortiWeb v5.0
9 -
FortiManager v5.0
9 -
4.0MR2
9 -
IP address management - IPAM
8 -
FortiBridge
8 -
WAN optimization
8 -
FortiGate v4.0 MR3
8 -
RMA Information and Announcements
7 -
FortiSOAR
7 -
FortiAnalyzer v5.0
7 -
SNMP
7 -
Web application firewall profile
7 -
Admin
7 -
4.0
7 -
Proxy policy
6 -
Security profile
6 -
Traffic shaping policy
6 -
Static route
6 -
FortiDirector
5 -
IPS signature
5 -
Packet capture
5 -
FortiAP profile
5 -
Automation
5 -
FortiManager v4.0
5 -
FortiDeceptor
4 -
Antivirus profile
4 -
DNS Filter
4 -
FortiTester
4 -
FortiCarrier
4 -
FortiCache
4 -
OSPF
4 -
Web rating
4 -
3.6
4 -
FortiScan
4 -
trunk
4 -
Port policy
4 -
System settings
3 -
Fortinet Engage Partner Program
3 -
FortiToken Cloud
3 -
Traffic shaping profile
3 -
FortiPAM
3 -
DoS policy
3 -
Email filter profile
3 -
FortiDB
3 -
Intrusion prevention
3 -
Protocol option
2 -
FortiInsight
2 -
NAC policy
2 -
Users
2 -
FortiAI
2 -
Application signature
2 -
VoIP profile
2 -
FortiHypervisor
2 -
Fabric connector
2 -
Netflow
2 -
Multicast routing
2 -
4.0MR1
1 -
TACACS
1 -
Subscription Renewal Policy
1 -
Replacement messages
1 -
FortiCWP
1 -
FortiNDR
1 -
Schedule
1 -
SDN connector
1 -
Authentication rule and scheme
1 -
FortiManager-VM
1 -
DLP sensor
1 -
Internet Service Database
1 -
Explicit proxy
1 -
Zone
1
Top Kudoed Authors
| User | Count |
|---|---|
| 1041 | |
| 862 | |
| 512 | |
| 441 | |
| 146 |
Broad. Integrated. Automated.
The Fortinet Security Fabric brings together the concepts of convergence and consolidation to provide comprehensive cybersecurity protection for all users, devices, and applications and across all network edges.
Security Research
Company
News & Articles
Copyright 2024 Fortinet, Inc. All Rights Reserved.