- Forums
- Knowledge Base
- Customer Service
- FortiGate
- FortiClient
- FortiAP
- FortiAnalyzer
- FortiADC
- FortiAuthenticator
- FortiBridge
- FortiCache
- FortiCarrier
- FortiCASB
- FortiConnect
- FortiConverter
- FortiCNP
- FortiDAST
- FortiDDoS
- FortiDB
- FortiDNS
- FortiDeceptor
- FortiDevSec
- FortiDirector
- FortiEDR
- FortiExtender
- FortiGate Cloud
- FortiGuard
- FortiHypervisor
- FortiInsight
- FortiIsolator
- FortiMail
- FortiManager
- FortiMonitor
- FortiNAC
- FortiNAC-F
- FortiNDR (on-premise)
- FortiNDRCloud
- FortiPAM
- FortiPortal
- FortiProxy
- FortiRecon
- FortiRecorder
- FortiSandbox
- FortiSASE
- FortiScan
- FortiSIEM
- FortiSOAR
- FortiSwitch
- FortiTester
- FortiToken
- FortiVoice
- FortiWAN
- FortiWeb
- Wireless Controller
- RMA Information and Announcements
- FortiCloud Products
- ZTNA
- 4D Documents
- Customer Service
- Community Groups
- Blogs
- Fortinet Community
- Knowledge Base
- FortiSOAR
- Technical Tip: CSTN 00037 - System Monitoring: Set...
- Subscribe to RSS Feed
- Mark as New
- Mark as Read
- Bookmark
- Subscribe
- Printer Friendly Page
- Report Inappropriate Content
This article describes the FortiSOAR™ System health monitoring framework. This framework is divided into two parts: Dashboard and Playbook.
Important: You are not required to set up the System Monitoring Playbooks from release 7.x onwards; instead you need to follow the steps mentioned in the Configuring System and Cluster Health Monitoring section in the System Configuration chapter of the "FortiSOAR Administration Guide."
System Monitoring Dashboard
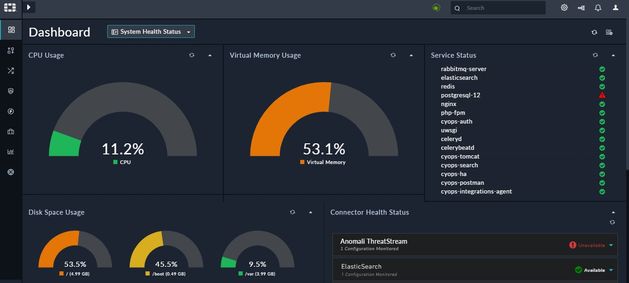
FortiSOAR™ includes a default system monitoring dashboard, the System Health Status Dashboard, which allows you to monitor various FortiSOAR™ system resources such as CPU, Disk Space, Memory Utilization, and status of various FortiSOAR™ services System Monitoring Dashboard displays information about disk space utilization for different partitions, virtual memory utilization, and CPU utilization of the running FortiSOAR™ instance.
The System Health Status Dashboard monitors the following:
- CPU Usage: Displays the percentage (%) of overall CPU utilization.
- Disk Space Usage: Displays the percentage (%) of disk space consumption for different partitions (per logical volume mount).
- Virtual Memory Usage: Displays the percentage (%) of overall Virtual Memory utilization.
- Service Status: Displays the status for all FortiSOAR™ services.
The advantage of having the System Health Status Dashboard is that now you do not require to log into the FortiSOAR™ server to check the various usage levels and you can also define various thresholds, as described in this article, for each system resource and if these thresholds are breached then you can take some corrective actions.
Setting up the System Monitoring Dashboard
- Create a Role named Dashboard with the following access:
CreateandReadaccess to theDashboardmodule.CreateandReadaccess to theConnectorsmodule
- Create a User whose type is set as Dashboard User.
- Clicking Settings > Edit Template to edit the settings of the System Health Dashboard as follows:
- Click Assign To Roles to assign the newly-created Dashboard role to the System Monitoring Dashboard.
- Click Configure Inputs and select the Enable Auto-Refresh checkbox to automatically refresh your dashboards or reports after the set time interval.
By default, the time interval is set at 10 minutes. You can modify the time interval according to your requirements.
System Monitoring Playbook
Important: Steps mentioned for setting up the System Monitoring Playbooks are applicable for only release 6.x. From release 7.x onwards, you do not need to configure playbooks for setting up system monitoring; instead, you need to follow the steps mentioned in the Configuring System and Cluster Health Monitoring section in the System Configuration chapter of the "FortiSOAR Administration Guide."
You can set up thresholds and notifications in the System Monitoring playbook that is included by default with FortiSOAR™ in the Sample - System Monitoring - x.x.x playbook collection.
You can define the threshold for CPU usage, disk space, and virtual memory utilization, at which this playbook should be triggered. You should also define the email IDs to which the notifications should be sent if the thresholds are reached. You can also create a schedule to schedule the System Monitoring playbook to run at regular intervals.
Configuring thresholds and notifications
To configure thresholds and notifications, do the following:
-
Click Automation > Playbooks and create a new collection named, ‘FortiSOAR System Monitoring’ or any other name of your choice.
-
Click the Sample - System Monitoring - x.x.x playbook collection and clone all the playbooks from this collection into the new collection that you have created in step 1.
Note: You must clone the sample playbooks and move them to a new collection before you update them since the sample playbook collections get deleted during the connector upgrade and delete. -
Click the System Monitoring playbook in the new collection to open it in the playbook designer.
-
Activate the newly cloned playbooks by clicking the Inactive button in the playbook designer.
-
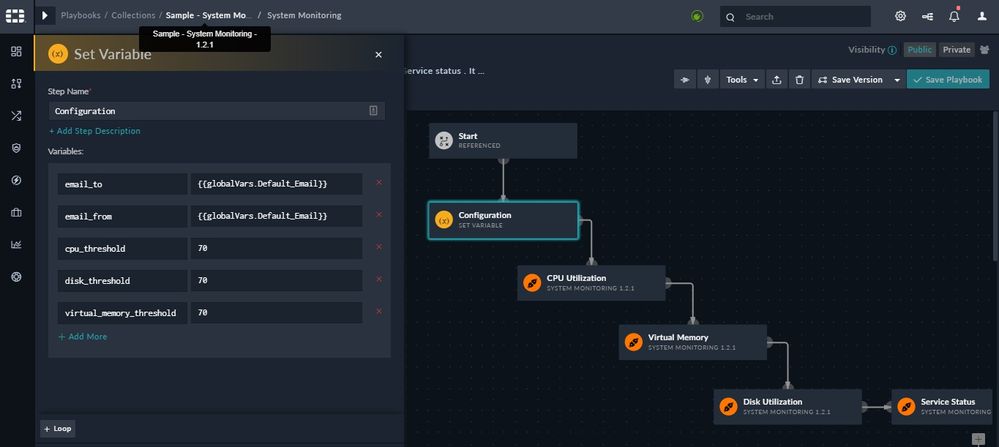
Click the Configuration step and change the values of the variables as shown in the following image:
-
For the email_to variable, enter the email address to whom the email should be sent if any of the thresholds set are breached.
Note: From FortiSOAR version 7.0.0 onward, the email that is sent for high CPU consumption will also contain information about the processes that are consuming the most memory. -
For the email_from variable, enter the email address from whom the email is sent if any of the thresholds set are breached.
-
For the cpu_threshold, disk_threshold, and virtual_memory_threshold variables enter the threshold values for all these variables and click Save to save the changes made to the Configuration step.
-
Click Save Playbook to save the playbook.
-
Creating a schedule for the System Monitoring playbook
You can also create a schedule to schedule the System Monitoring playbook to run at regular intervals and update the System Health Status Dashboard.
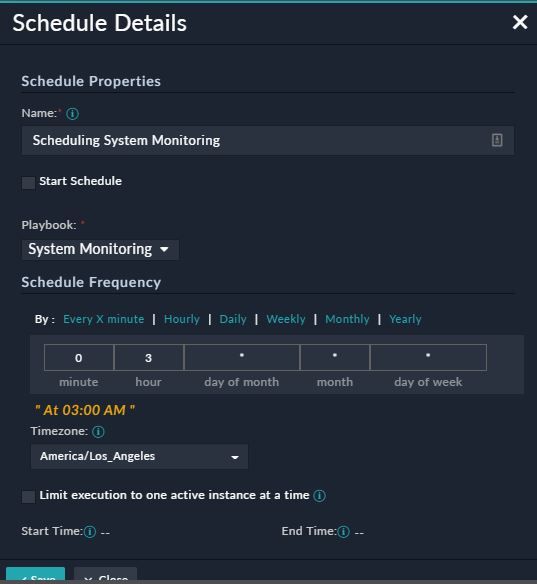
To schedule the System Monitoring playbook, click Automation > Schedules, and on the Schedules page, click Create New Schedule. This displays the Schedules Details dialog, in which you can create a schedule as per your requirements. Ensure that you select System Monitoring from the Playbook drop-down list.
Following is an image of a sample schedules dialog for the System Monitoring playbook that has been scheduled to run daily at 3 am:
To know more about how to create schedules, see FortiSOAR™ product documentation: Schedules chapter in the "User Guide."
The Fortinet Security Fabric brings together the concepts of convergence and consolidation to provide comprehensive cybersecurity protection for all users, devices, and applications and across all network edges.
Copyright 2024 Fortinet, Inc. All Rights Reserved.


