
Deepak_Girimaji_FTNT
Staff
Staff
May 3, 2016

Technical Tip: How to enable debug log in FortiClient

  • October 8, 2026 at 7:33 AM
  • 0 replies
  • 67178 views

Description

This article explains how to enable debug logging in FortiClient.

Scope

FortiClient.

Solution

To enable debug logging in FortiClient:
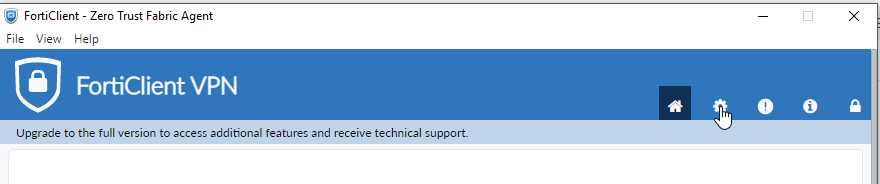
  1. Open FortiClient.

  2. Go to Settings.

f776fef6.png


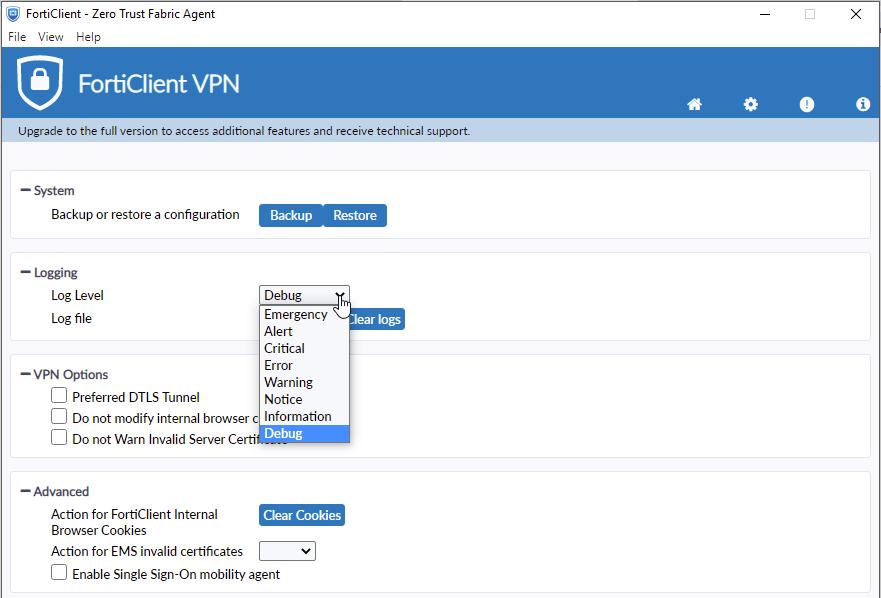
  1. Under Logging, set Log Level to Debug, as shown below:

1ed08497.png


  1. Click "Export Logs" and save the logs to a location of your choice.


For FortiClient Free versions, if the Log Level option is greyed out, select the lock icon in the top-right corner to unlock the settings before changing the debug level.
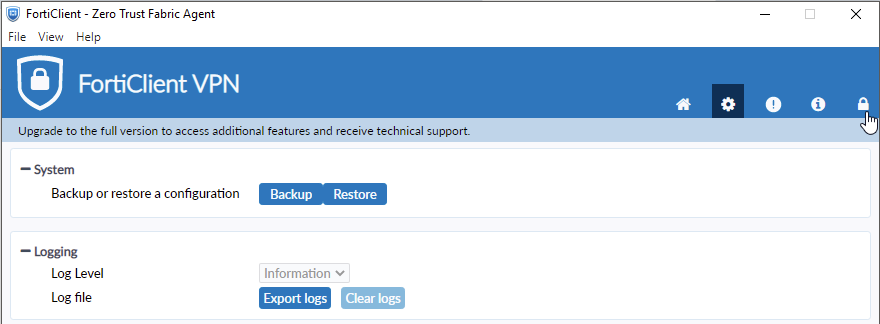
09ec9c41.png


Note:

Proposals cannot be changed unless an EMS licence is acquired.


For FortiClient that are managed through EMS, the logs can be collected from the EMS portal by following these steps:

  1. Configuring and collecting Endpoint Debug logs under EMS -> Endpoint Profile, select Edit -> System Settings, use Advanced instead of Basic settings -> Log Level -> Change 'info' to 'debug and select all features.

  2. Reproduce the problem.

  3. Go under FortiClient -> Section 'About' -> Diagnostic Tool, check everything, run Diagnostic Tool, and the output file should have '.cab' or '.zip' extension, usually present in '%temp%\Diagnostic_Result'.

  4. Reverting configuration under EMS -> Endpoint Profile, select Edit -> System Settings, use Advanced instead of Basic settings -> Log Level, change 'debug' to 'info' and deselect features not needed (or all of them).


Related article:

Technical Tip: How to collect diagnostic logs from EMS and FortiClient for troubleshooting

    Thought Leadership. Security Summit. Thursday, November 12th, PGA National Resort, Palm Beach Gardens, FL.
    Security Operations Summit: Modernize SecOps. Operate AI-Native.AMER: November 4 | 9:00 AM PST. India and SAARC: November 5 | 10:00 AM IST. EMEA: November 5 | 10:30 AM CET. APAC: November 5 | 11:00 AM SGT