FortiGate packet capture behavior differs between the graphical user interface (GUI) and the command-line interface (CLI).
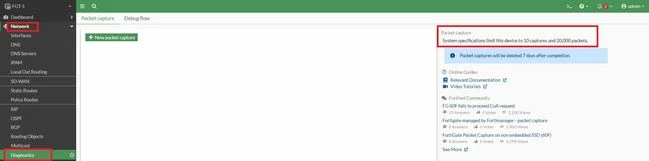
Packets can be captured via the GUI by navigating to: Network -> Diagnostics -> New Packet Capture. Steps: Select the required interface. Configure capture filters as required. Select Start capture to begin immediately or Save settings to use later.
GUI limitations:
There are limits on the number of simultaneous packet captures and the maximum number of packets per capture, which are based on system specifications.
From FortiOS 7.4.4+, to determine the maximum number of packet captures supported per device, utilize the Maximum Values Table and look for the parameter firewall.on-demand-sniffer.
Packet capture initiated from the CLI is not subject to GUI packet count restrictions, and the same is displayed in the GUI as well.
 Note: The built-in GUI CLI must not be used for high-volume packet capture, as it cannot handle large volumes of traffic output. Gain access to FortiGate via SSH. Large packet capture through the CLI requires SSH access using PuTTY or a similar SSH client. On how to connect to FortiGate using SSH, refer to this article: Technical Tip: How to connect to FortiGate using SSH. Before starting packet capture, logging must be enabled in PuTTY.
Steps: Open PuTTY. Navigate to Session -> Logging. Select Printable output. Enable Always append to the end of the log file. Specify the log file location and other parameters.
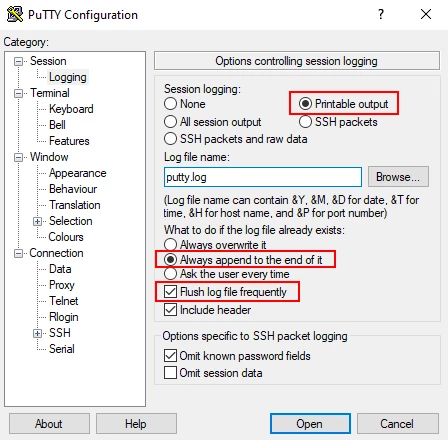 Reference: Technical Tip: How to create a log file of a session using PuTTY. The following command can be used to run a packet capture:
Interface-specific capture: Specify the actual interface instead of any when troubleshooting a particular traffic path. This helps isolate where packets are entering or leaving the FortiGate.
diagnose sniffer packet <interface> "host <IP>" 6 <count> l
Example:
Capture from one source network to a destination network.
diagnose sniffer packet any ‘src net 192.168.1.0/24 and dst net 172.16.1.0/24’ 6 0 l
Replace <Interface> with the specific interface name if required or any. Replace <IP> with the preferred IP address. Replace <count> with the desired number of packets (use 0 for unlimited capture). Verbosity 6 is generally used for detailed troubleshooting because it shows the Ethernet header (MAC addresses), the IP header, payload data, and confirms which interface the packet is ingressing or egressing. When finished, to stop the capture, use Ctrl + C.
Once the log file is gathered, convert the file to a pcap file so it can be reviewed via Wireshark.
See: How to import 'diagnose sniffer packet' data to WireShark
Bidirectional traffic analysis: Use source and destination IP filters together to capture traffic in both directions between two hosts and identify missing request or response packets.
diagnose sniffer packet any 'host 192.168.1.10 and host 172.16.1.10' 4 0 l
Related article: |